Towards Metric-Agnostic Trajectory Forecasting

ECCV 2026

1RWTH Aachen University 2Eindhoven University of Technology

Abstract

Accurate trajectory forecasting of surrounding traffic participants is a core capability for autonomous driving, enabling vehicles to anticipate behavior and plan safe maneuvers. We observe that current state-of-the-art forecasting models on Argoverse 2 and the Waymo Open Motion Dataset tailor their training objectives to the different benchmark metrics. Because these metrics encourage conflicting behavior, we propose a paradigm change for trajectory forecasting: training models with metric-agnostic probabilistic objectives and treating metric optimization as a downstream task applied to the predictive distribution. Concretely, we introduce Trajectory Distribution Evaluation (TraDiE) policies, metric-specific policies that map a predictive distribution to the set of K trajectories and confidences required by trajectory forecasting metrics. We evaluate this framework by introducing DONUT-NLL, which adapts the training objective of the state-of-the-art trajectory forecasting model DONUT to directly optimize the predictive distribution. Using our policies, DONUT-NLL achieves state-of-the-art results on all metrics of the Waymo motion prediction benchmark.

Trajectory Forecasting Metrics

Comparison of minFDE and mAP metrics.

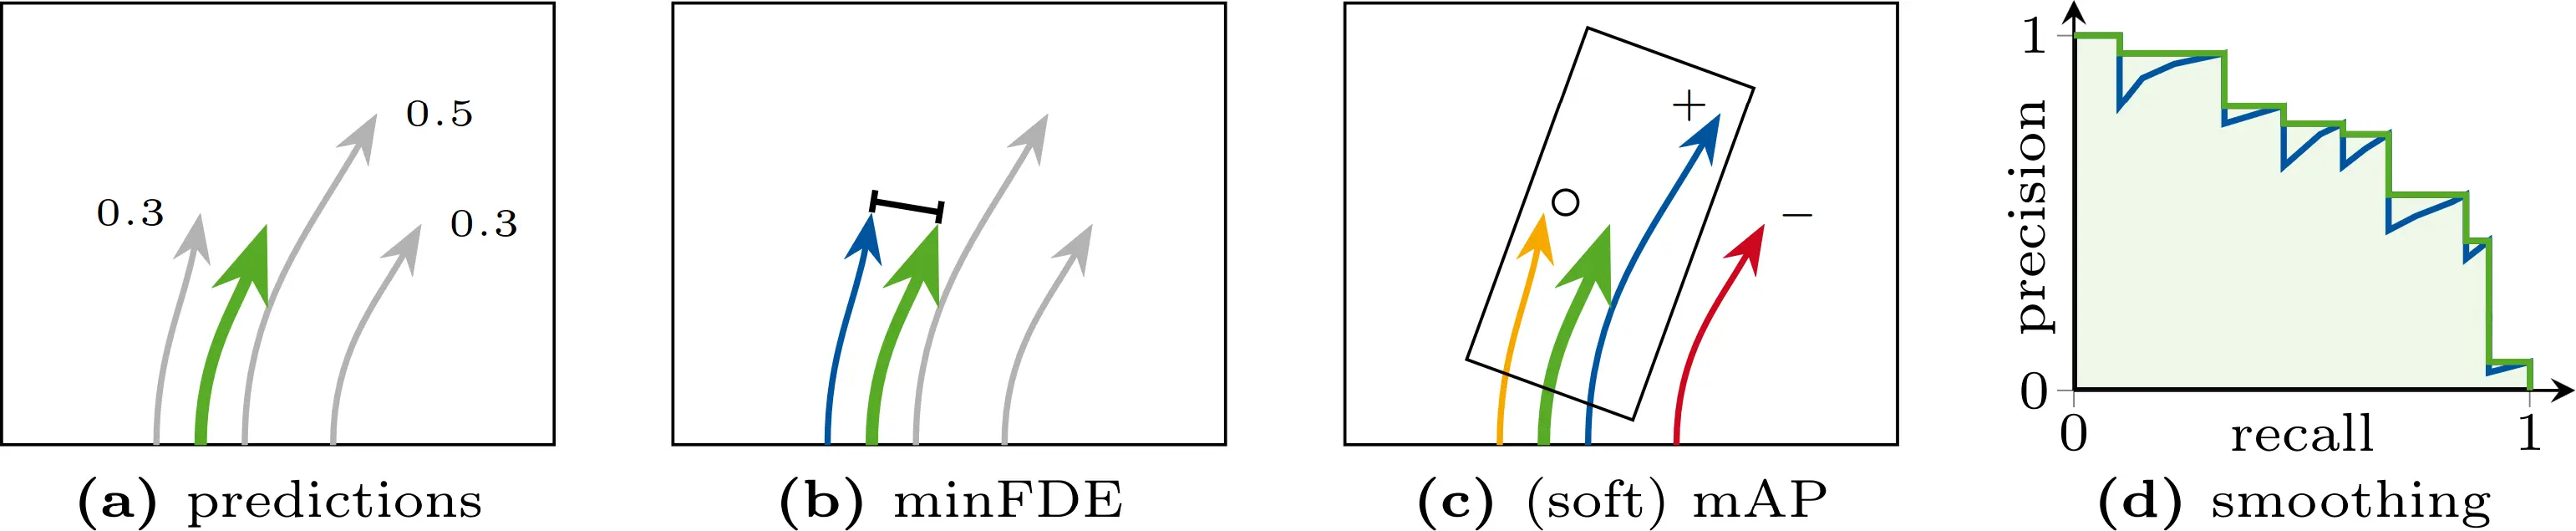
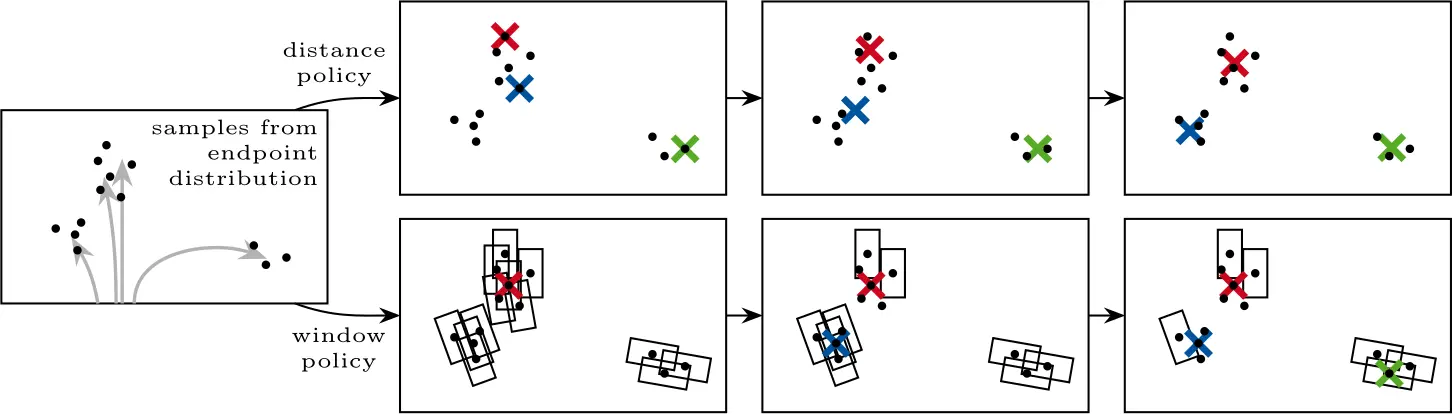
(a) A trajectory prediction model outputs predictions with assigned confidences.

(b) For the distance-based metric minFDE, the endpoint distance between ground truth and closest prediction is calculated.

(c) For the window-based metric (soft) mAP, an oriented window is placed around the ground-truth endpoint. The highest-confidence trajectory within the window (+) counts as a true positive, additional trajectories within the window () are either counted as false positives (mAP) or ignored (soft mAP). Predictions outside the window () count as false positives.

(d) To obtain the (soft) mAP, a precision-recall curve is created for each confidence score over the entire dataset and then smoothed; the area under the curve is the final metric.

Crucially, these metrics reward conflicting goals: minFDE improves if many endpoints are close to the main mode, whereas endpoints within the same window in (soft) mAP get penalized or ignored.

TraDiE Policies

Visualization of our TraDiE policies for minFDE and mAP.

Both policies start from samples of the endpoint distribution () of the model's prediction (left). Both policies output new endpoints (×, ×, ×) which aim to optimize the metric under the predictive distribution.

For minFDE (top row), we initialize the new endpoints randomly and directly optimize the minFDE error given the samples from the model's predictive distribution.

For (soft) mAP (bottom row), we put an evaluation rectangle around each of the samples, and iteratively select the point which is covered by the most rectangles as the next endpoint. Rectangles already covered are omitted from the next iterations. Confidences are computed as the proportion of rectangles covered by an endpoint.

If optimizing the metrics under the model's predictive distribution produces strong benchmark results, this indicates that the model has learned an accurate representation of uncertainty in the real world.

Experiments and Results

For the main experiments, we use our previous work DONUT, which achieves SOTA results on Argoverse 2. The default winner-takes-all (WTA) loss directly optimizes the minFDE metric instead of aiming for a well-calibrated predictive distribution. For this reason we propose DONUT-NLL which directly optimizes the distribution. We implement two variants: Traj-NLL uses a mixture weight per trajectory, whereas Step-NLL uses a weight per timestep.

Study of training objectives. Combining our distance or window policies (indicated by →) with NLL training consistently outperforms the naive WTA predictions. Notably, naive evaluation suggests different design choices than evaluation with policies (X vs. X). Evaluation on Waymo val.
Study of position distributions. Generalized Gaussians outperform the alternatives under policy optimization. All models use the Step-NLL objective. Evaluation on Waymo val.
Additional baselines. MTR consistently improves; QCNet degrades for minFDE due to its poor predictive distributions. Evaluation on Waymo val.

The above results provide a number of key takeaways:

  1. Our TraDiE policies are effective at turning a single distribution into strong performance across heterogeneous metrics.
  2. Our policies detect poorly calibrated predictive distributions.
  3. Step-NLL combined with generalized Gaussian position distributions outperforms other losses and distributions for DONUT-NLL.
  4. Optimizing for distributions instead of metrics favors different design choices.
  5. Our analysis of predictive distributions via policies extends to other models.
Comparison with the state of the art on Waymo test. We mark ensembles with e, and omit methods that train on additional data or use LiDAR. DONUT-NLL achieves state-of-the-art results on all metrics, without requiring retraining.

BibTeX

@inproceedings{knoche2026tradie,
  title     = {{Towards Metric-Agnostic Trajectory Forecasting}},
  author    = {Knoche, Markus and de Geus, Daan and Leibe, Bastian},
  booktitle = {ECCV},
  year      = {2026}
}